

Expected Utility
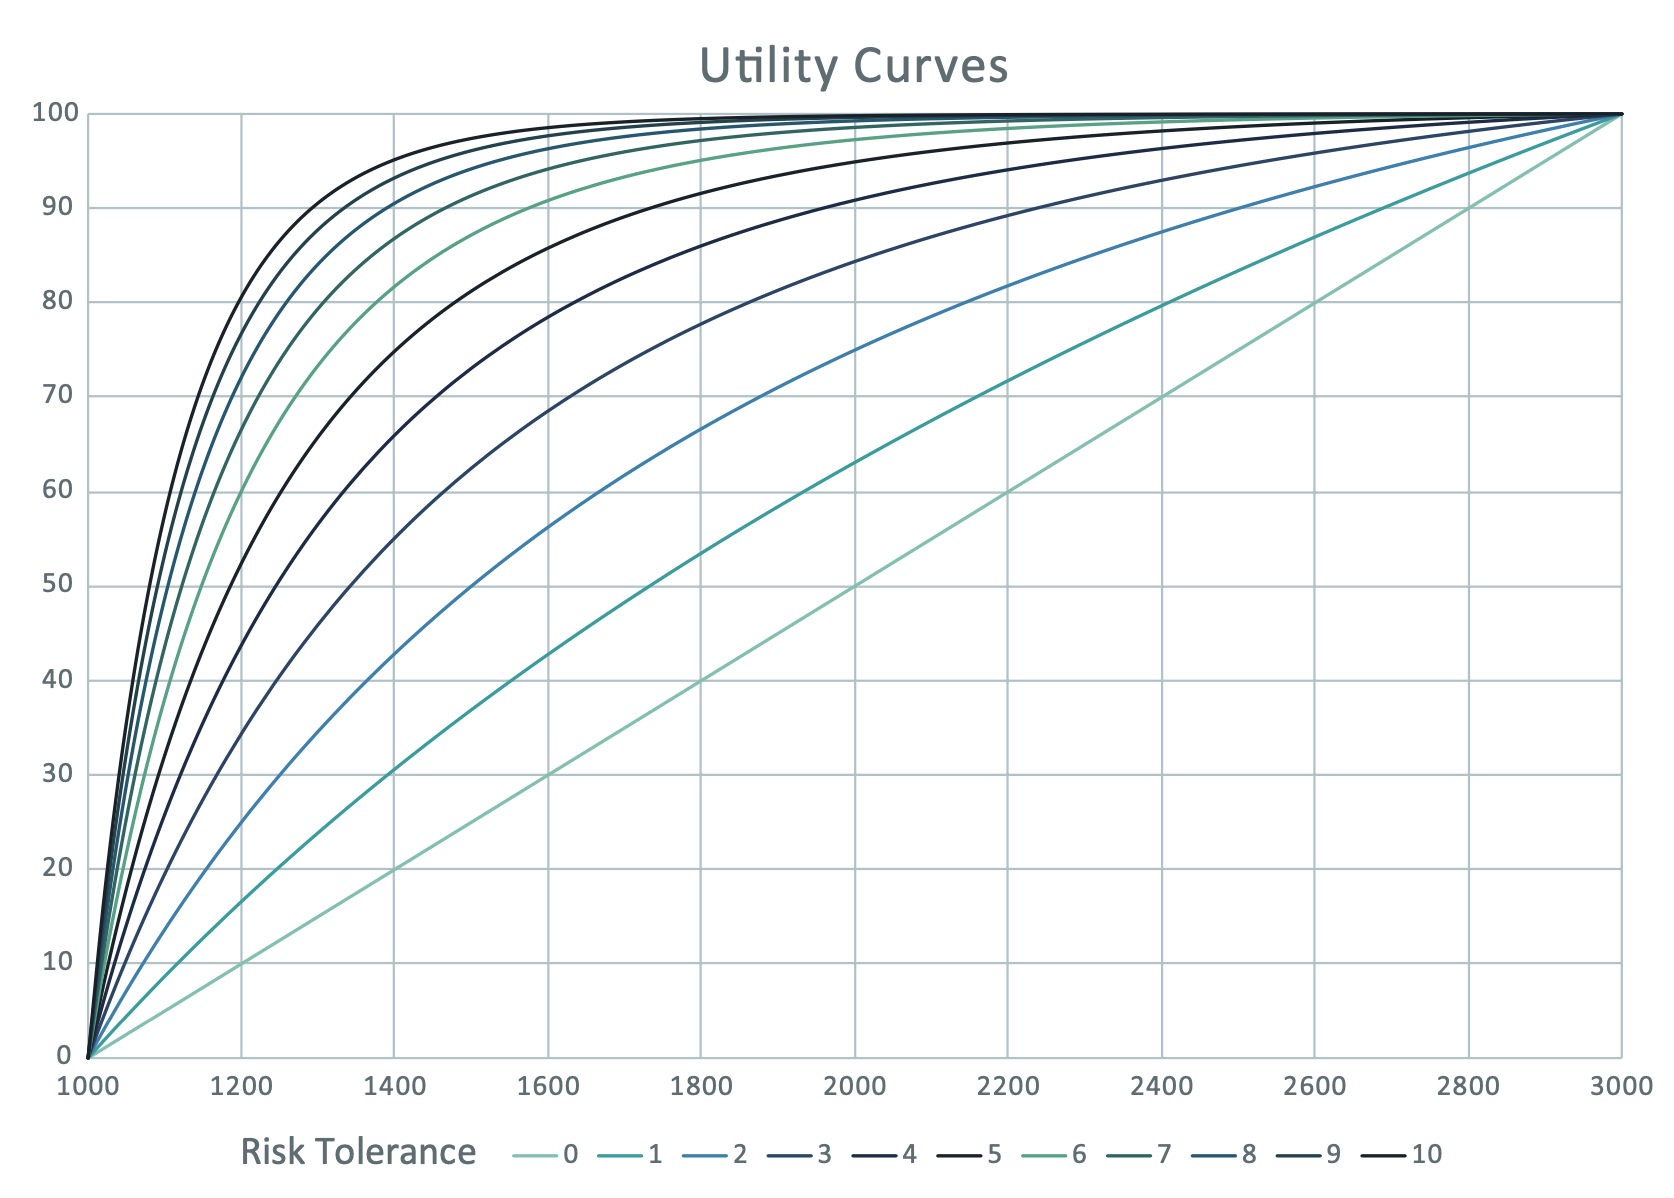
Finbotx uses expected utility theory to quantify an individual investor’s risk appetite. Depending on an investor’s available wealth and investment goals, different investment scenarios may yield different levels of satisfaction to this investor. The rate at which the perceived utility of a change in wealth or income increases or decreases can be shown by means of a utility curve. By combining utility theory with Finbotx’ state of the art scenario generator, we can calculate the happiness equivalent of thousands of financial market scenarios of any portfolio for any client.
Quantifying Happiness
Easy to Use
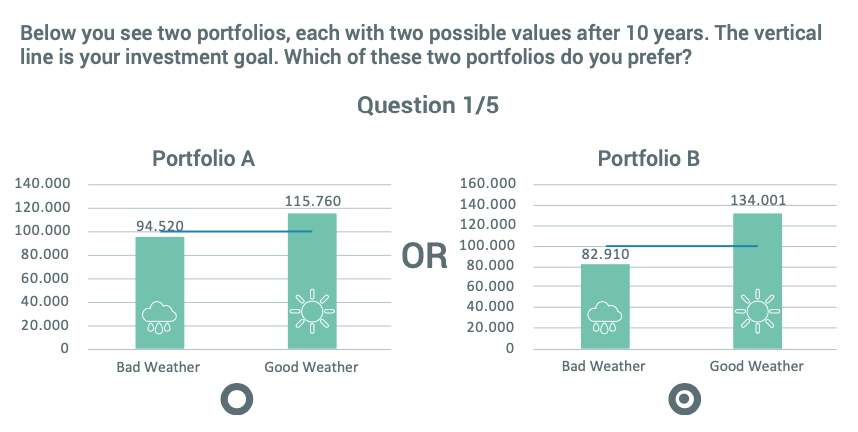
Just 5 to 10 simple questions are sufficient to derive your client’s utility curve, taking into account your clients’ personal circumstances and investment goals.
Checks for Inconsistencies
We compare the answers given with a reference group to check for inconsistencies. This way we automatically flag behaviour that signals the client doesn’t understand the questions and/or generate additional questions to be certain the client’s preferences are accurately mapped.
Academically Sound
The Finbotx risk profiling engine has been developed by behavioural scientists and econometricians. The concepts used are well accepted within the academic community, with the concept of Expected Utility going back almost 300 years[1]. The Finbotx risk profile engine builds on the work of Nobel laureates such as Richard Thaler, Daniel Kahneman, Paul Samuelson and Kenneth Arrow.
[1] Bernoulli, Daniel (1738), “Specimen Theoriae Novae de Mensara Sortis”, Commentarii Academiae Scientiarum Inperialis Petropolitanae.
From Euro to Utility
The big advantage of utility based risk profiling is that, once we have determined a client’s personal utility curve, we can calculate the amount of happiness of all possible investment outcomes. This is especially powerful when used in combination with an economic scenario generator, where
thousands of possible outcomes of an investment portfolio can all be translated into a happiness equivalent. By calculating the happiness equivalent for all available model portfolios/risk profiles, one can identify the risk profile that generates the most (expected) happiness for your client.
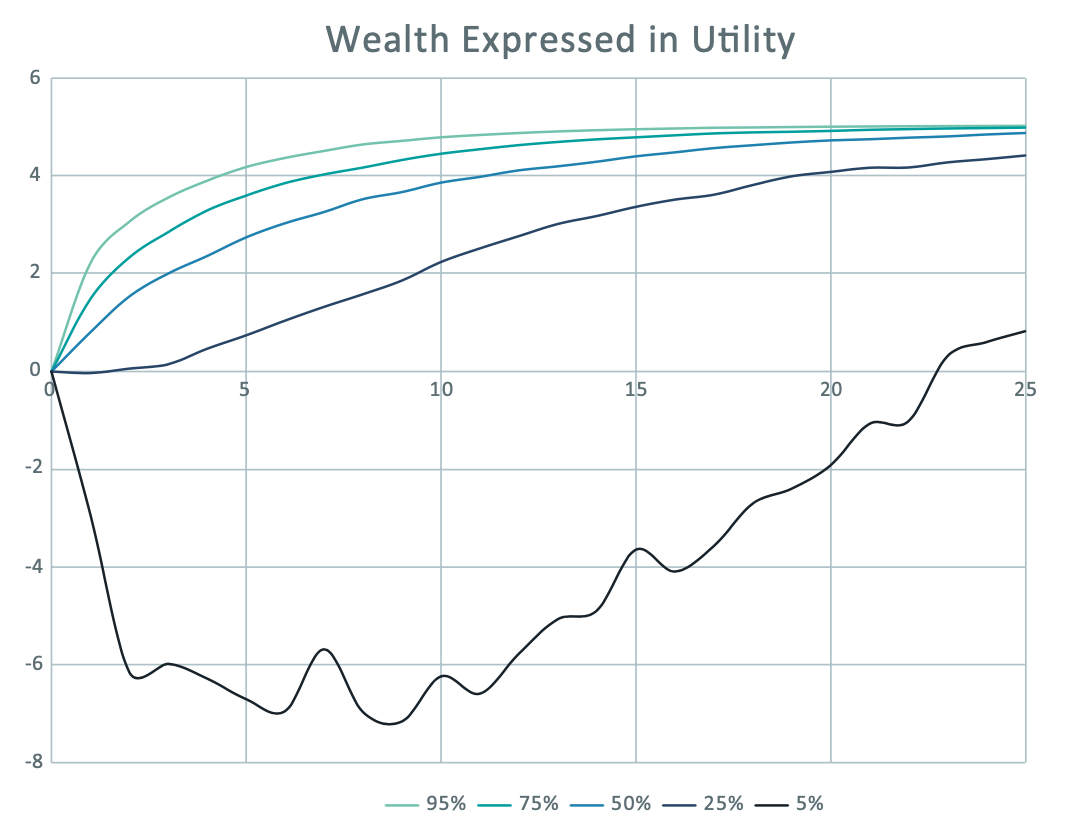
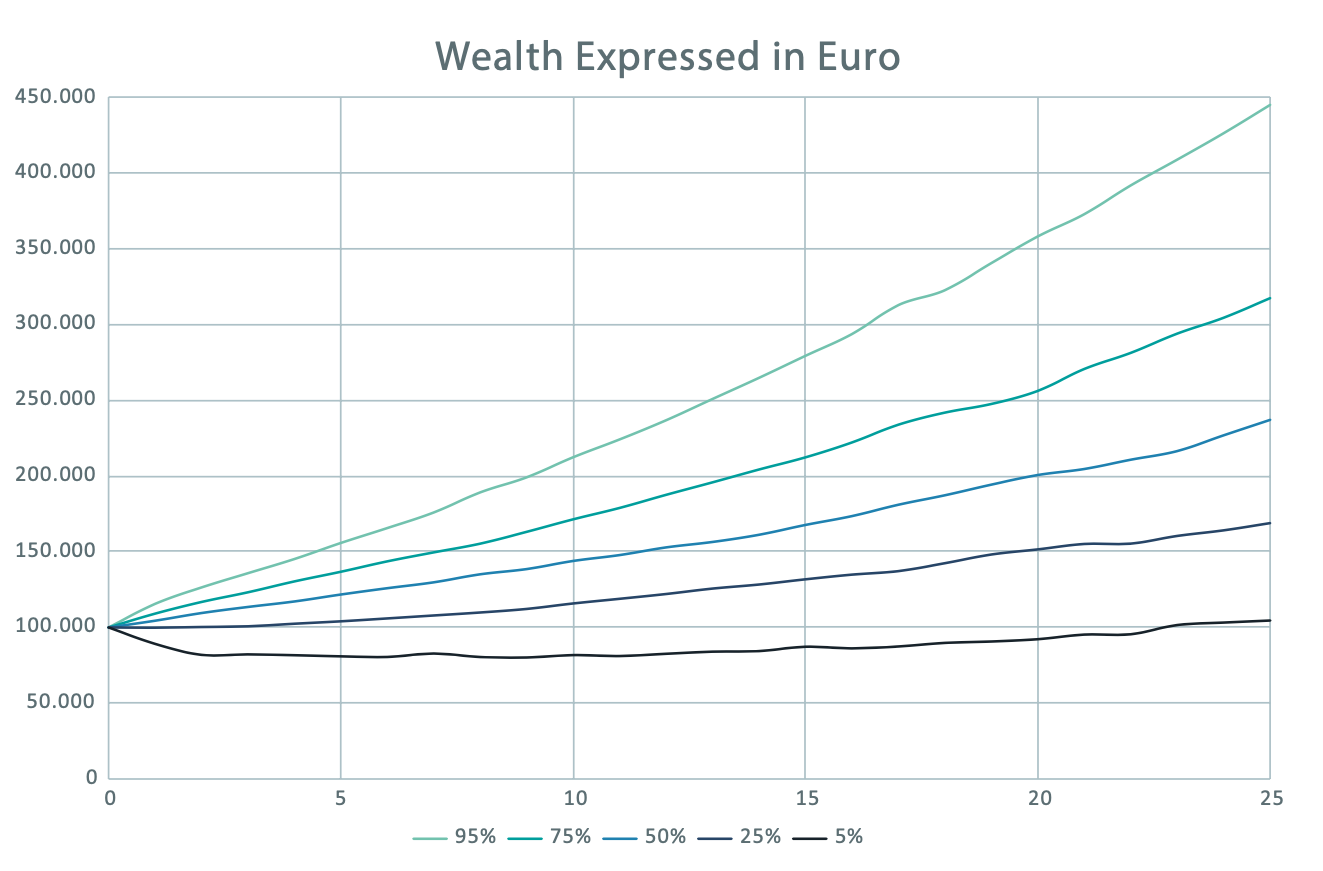
Utility theory in practice. The left graph shows the euro value of a client’s portfolio over time, in a number of scenarios (the median and the 5th & 25th best/worst percentile are shown). The graph on the right shows the utility value of these outcomes. For this (relatively) risk-averse client, the bad scenarios especially have a large negative value, creating more unhappiness than the positive outcomes create bliss.
Long vs. Short Term Risk Preference
Although adopting a long-term goals-based approach is the rational thing to do, investors do need to cope with short term volatility. By measuring short term risk appetite separately, and subsequently balancing this with long term risk appetite, the best fitting portfolio can be selected
Realistic Scenarios
Utility based risk profiling enables us to quantify the happiness or suffering that financial market scenarios cause. Characteristics such as negative skewness in portfolios will have a significantly higher impact on the happiness of very risk averse clients compared to risk seeking clients.
Realistically modelling negative skewness and fat tails of financial market returns, as is done with the Finbotx scenario generator, is therefore paramount when determining which portfolio suits your client best. Using what-if scenarios one can quantify the pain a market crash would cause a specific client.
Preferred by Regulators
Regulators prefer quantitative risk profiling methods because of its transparency and accuracy[1]. Research performed by the Dutch regulator favoured a utility-based approach with a choice sequencing decision tree, such as the Finbotx methodology, over other methods. Other research has also shown that ‘traditional’ semantic questionnaires provide (too) little accuracy.
[1] Van der Meeren, Gust, Hannie de Cloe-Vos & Alexandra van Geen (2019), “Meet risicobereidheid met een kwantitatieve methode”, Economisch Statistische Berichten (ESB)
Accuracy (R2)
Quantitative Risk Profiling:
77%*
Traditional (semantic) Questionnaire:
<13%**
* Libosan, 2018
** Dohmen et al, 2011